In almost every food company certified IFS, BRC, or FSSC 22000, there is one person — sometimes two — who spends a significant portion of their working time opening analysis report PDFs, reading values one by one, and retyping them into an Excel file.
That file is the control plan. It is what proves to the auditor, the key account customer, and the food safety authorities that incoming materials have been controlled, that thresholds have been respected, and that non-conformities have been identified and addressed.
It is also, more often than not, a silent time bomb.
In this article, we will cover the following topics:
- The real cost of a full-time equivalent dedicated to data entry
- The blind spot nobody measures: control plan coverage
- Lab thresholds vs internal thresholds: a critical distinction
- The screening problem: comparing analyses that don't test the same molecules
- How Tracklab addresses these four problems
- What changes in practice
The real cost of a full-time equivalent dedicated to data entry
Take the numbers from a common situation: a food processing company, IFS Food certified, receiving around 200 analysis reports per year. Multiple sources — suppliers, partner laboratories such as Eurofins, Phytocontrol or Carso, internal analyses.
For each report, the process is identical: receive the PDF, read the criteria, manually enter values one by one into the tracking tool, verify conformity, archive. On a pesticide report with 30 to 50 detected molecules, expect between 20 and 45 minutes. Across 200 reports per year, that easily adds up to two to four full-time-equivalent weeks spent on transcription.
The direct cost is quantifiable. The indirect cost is more insidious: a person whose 40% of time goes to data entry is not analyzing. Not steering. Not building next year's control plan. Not detecting emerging trends. Transcribing.
And when that person is absent, everything stops. The dependency on one or two people who "know where everything is" is one of the most underestimated operational risks in quality departments.
The blind spot nobody measures: control plan coverage
Manual data entry has a second flaw, less visible but more dangerous: it does not show what has not been analyzed.
An Excel file of analysis results is, by construction, a list of what has been done. It contains no row for "supplier X, product Y, pesticide campaign 2025: not completed." The absence of a row signals nothing. It is invisible.
Regulatory risk: a critical product that was not analyzed during a reference period is not flagged as a gap in a results file. It is simply absent. The discrepancy only surfaces at the time of an audit or an incident — too late.
The central question is not "what are my results?" It is: did I analyze what I committed to analyzing? The actual coverage rate of the control plan. How many product-supplier pairs had a defined analytical frequency, and for how many was that analysis actually carried out?
In the vast majority of cases, nobody knows precisely. Because the control plan is in one Excel file, the results are in another, and the reconciliation between the two is a manual task that nobody performs on an ongoing basis.
The honest answer, in nine cases out of ten: no.
Lab thresholds vs internal thresholds: a critical distinction
When a laboratory delivers an analysis report, it includes a conclusion: conforming or non-conforming. That conclusion is calculated against its own references — most often the applicable regulation.
The problem: regulation is a floor, not a standard. The internal or customer requirements of a GFSI-certified company are frequently more stringent than the regulatory threshold. A contaminant may be "conforming" according to the lab and still trigger an alert under internal specifications or customer commitments.
"The conclusion is useless. Lab conclusions are often meaningless. We have our own rules, our own thresholds, our own interpretations. Honestly, I never look at the lab's conclusion." Quality Director, tea and herbal infusion industry
This gap between the lab conclusion and internal conformity is structural. It generates three concrete types of risk.
Silent non-conformity. A result classified as conforming by the lab exceeds the internal threshold without triggering any alert. The product is released.
Late detection. The discrepancy is discovered during the annual Management Review, when it is too late to trace back the decision chain.
Inability to prove. In the event of an audit or incident, the company cannot demonstrate that its internal thresholds were systematically applied.
A fourth risk, less obvious: threshold obsolescence. Internal thresholds evolve with regulation. Without version tracking, it is impossible to know which threshold was in force at the time of a past decision. When a threshold is updated in a non-versioned system, all historical analyses appear retrospectively conforming or non-conforming under the new threshold — making the historical record unusable for understanding past decisions.
The screening problem: comparing analyses that don't test the same molecules
For companies working with complex raw materials — teas, spices, aromatic herbs, cereals — pesticide analysis management introduces an additional layer of complexity: the screening.
A pesticide screening is the list of molecules tested during an analysis. Laboratories offer different standard screenings. Manufacturers often define their own, more comprehensive screening in agreement with their partner laboratory. A screening may cover 300 molecules. Or 750. Or 1,200.
"A supplier can give us a clean analysis if they only tested a hundred molecules. And that same analysis can come back bad when we test for 750." Quality Director, tea and herbal infusion industry
The practical consequence: when a company receives a supplier analysis, it cannot simply read the results. It must first validate that the supplier's screening covers the molecules it is itself testing for. If the supplier did not test for molecule X, the result "not detected" is not information — it is an absence of information.
Performing this comparison manually, for every report, across 750 molecules, is today virtually impossible in practice. The consequence: most companies require their suppliers to carry out analyses using their own screening, at their referenced laboratory. Which generates cost, supplier friction, and prevents them from using the analyses the supplier already conducts for its own clients.
How Tracklab addresses these four problems
Tracklab's Augmented Analysis module was built to address these four problems simultaneously, not in isolation. It is structured around four functional blocks.
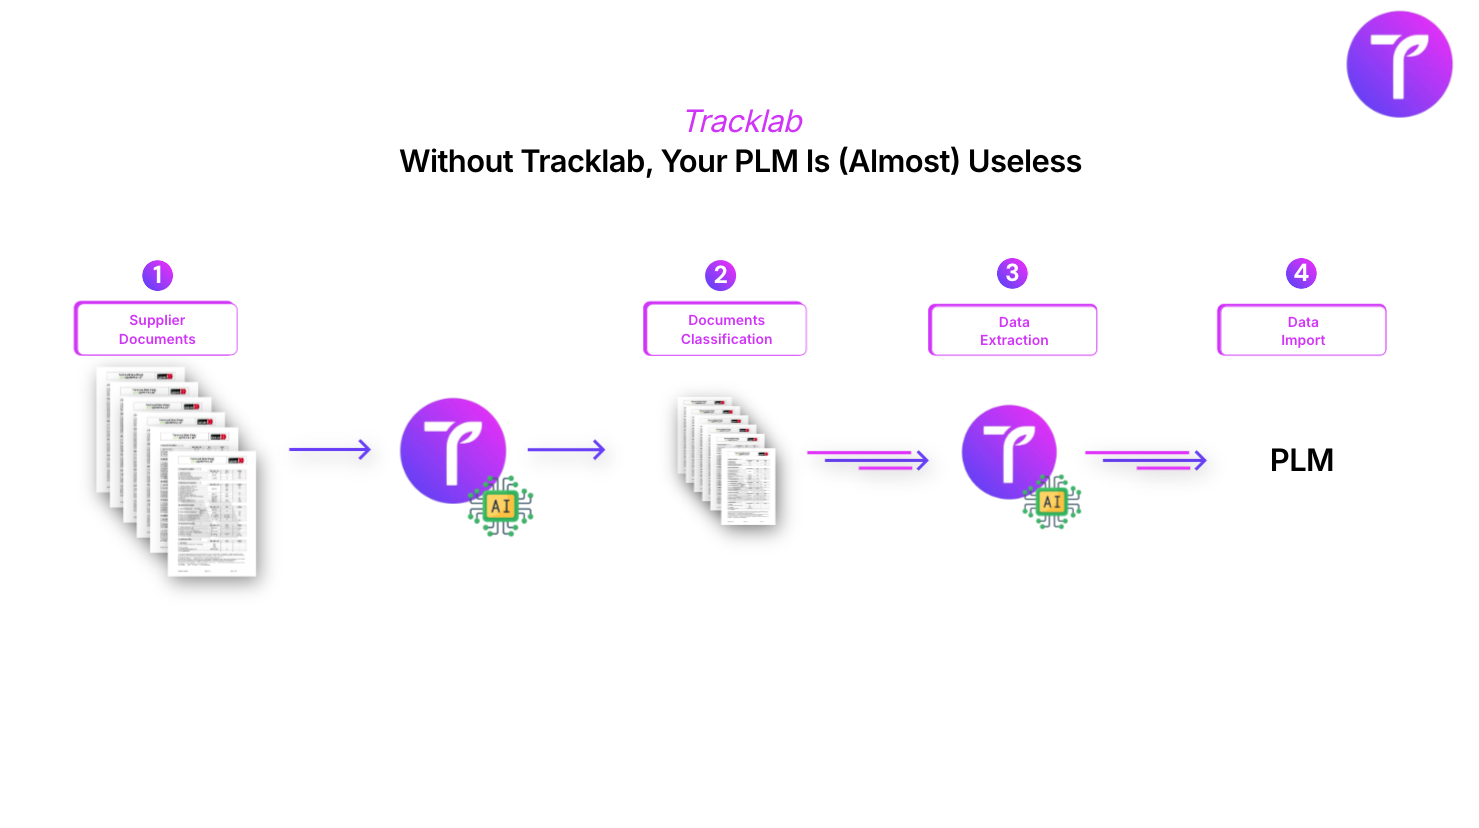
1. Centralized collection and automatic AI extraction
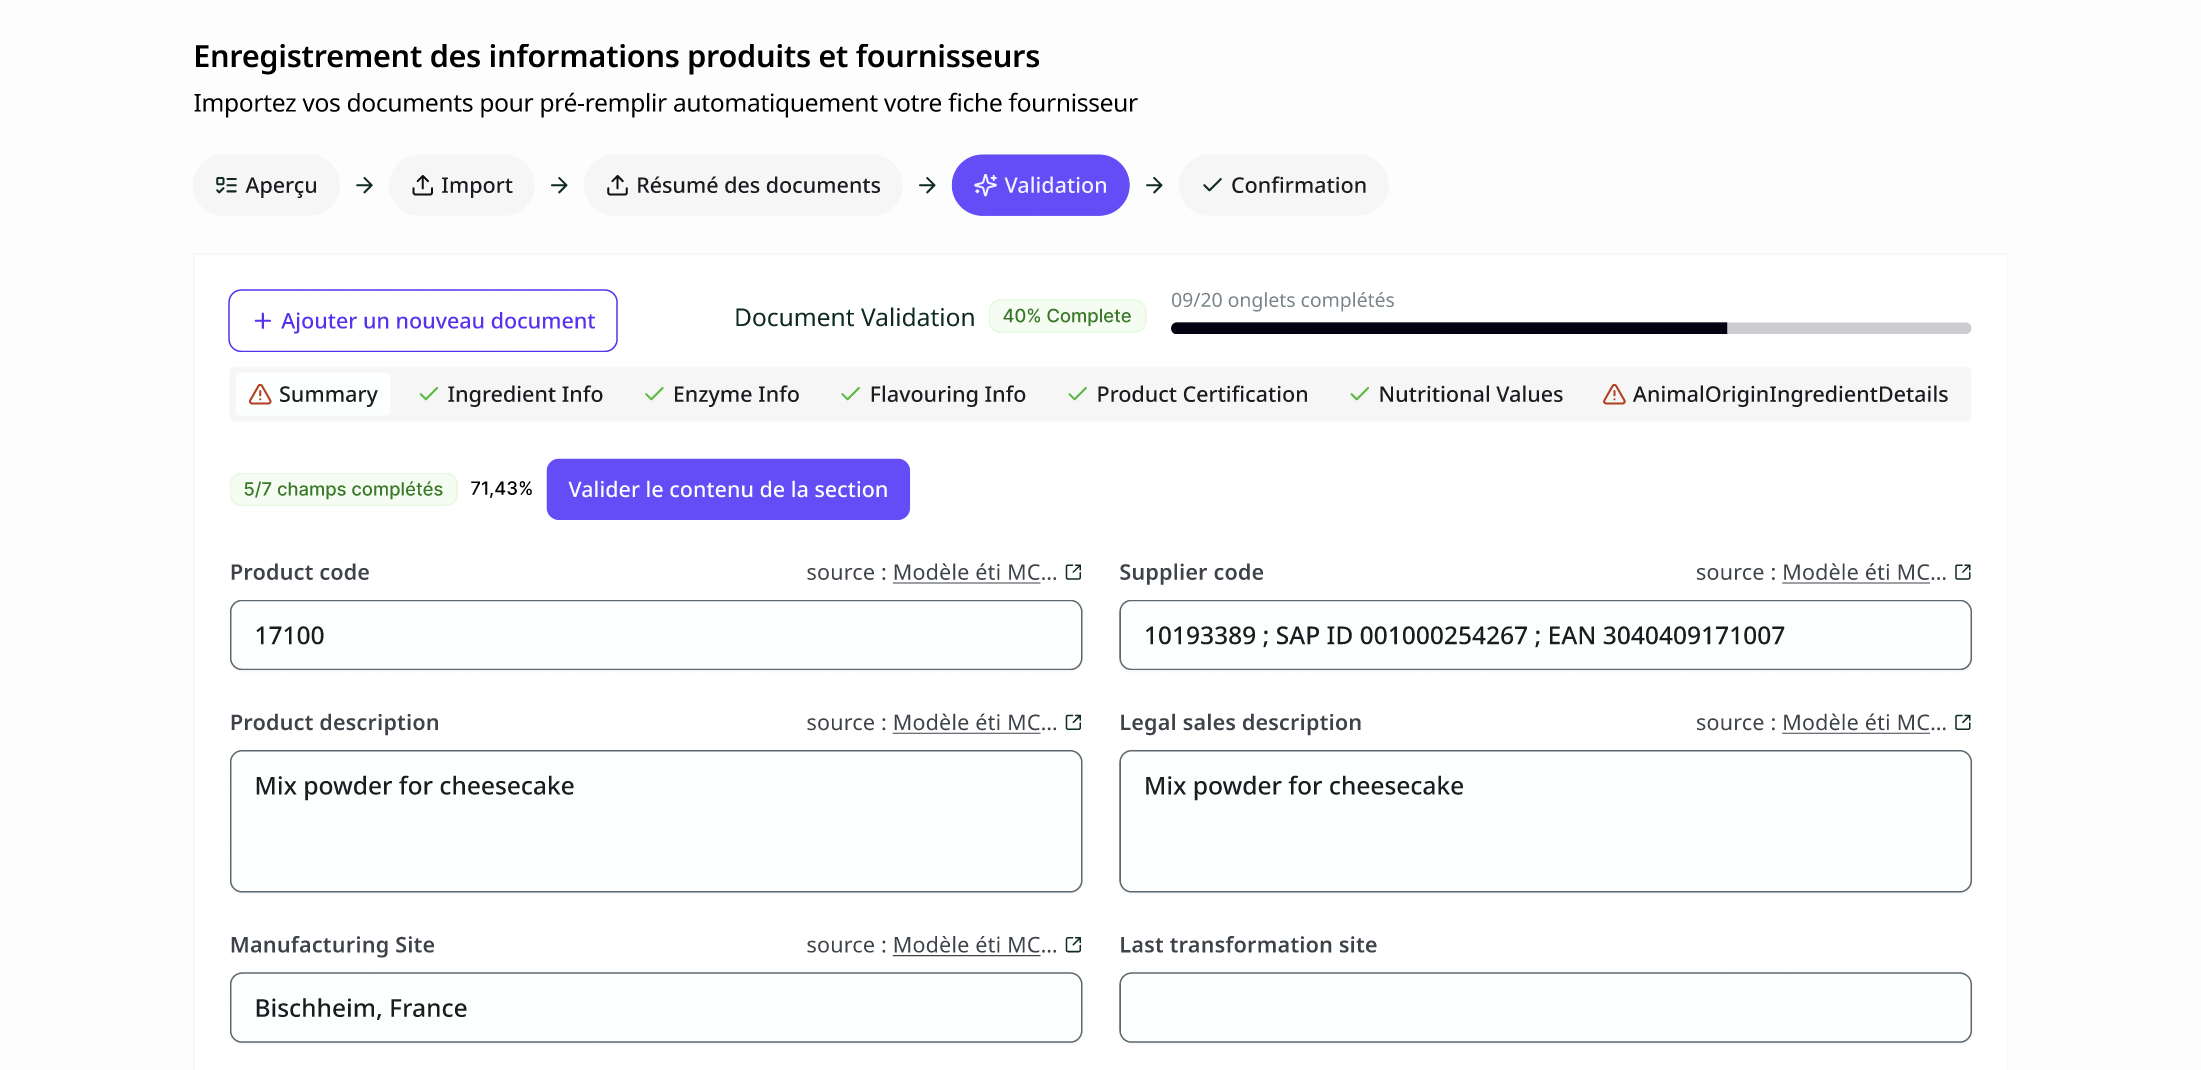
A dedicated email inbox receives all reports — from suppliers, partner laboratories, and internal labs. The AI automatically extracts all structured information: analyzed criteria, values, units, methods, lab thresholds, sampling dates, requester, sample code. Data is available immediately, with no manual entry.
2. Configurable internal thresholds, independent of lab thresholds
Teams configure their own alert and blocking thresholds by substance — entirely independent of the laboratory's conclusion. Conformity is recalculated against internal requirements. When a threshold changes, prior history is frozen: each analysis retains the conformity calculated at the time the decision was made, under the threshold that was then in force.
3. Control plan with real-time coverage rate
The module feeds a structured control plan: for every product-supplier pair, for every configured analysis type, Tracklab shows in real time what has been analyzed and what is pending. Coverage rate is calculated automatically. No critical supplier, no sensitive product falls through the cracks.
4. Actionable dashboards for audits, customers, and buyers
Real-time dashboards on conformity by supplier, by analysis type, by period. Audit exports in a few clicks. Dashboards shareable with key account customers. Consolidated analytical data by supplier for buyers, enabling sourcing decisions based on objective performance data. Analysis reports retrievable in seconds for customs.
What changes in practice
Entering a report today takes between 20 and 45 minutes depending on its density. With Tracklab, extraction is automatic: upon receipt, all criteria, values, units, and metadata are structured and available. Processing time drops to a matter of seconds.
Non-conformity detection no longer depends on a visual comparison between the report and an internal threshold file. Tracklab automatically recalculates conformity against configured internal requirements — independently of what the laboratory concluded. A molecule that exceeds the internal threshold triggers an alert, even if the lab classified the analysis as conforming.
Control plan coverage, which was previously unknown on an ongoing basis and manually reconstructed in a rush before every audit, becomes visible in real time. For every product-supplier pair and every configured analysis type, Tracklab shows what has been completed and what is pending. No sensitive product disappears from the radar for lack of visibility.
Preparing a report for an audit or a Management Review, which previously required hours of manual processing, is reduced to an export in a few clicks.
When a key account customer or customs requests a report, it is retrievable and transmissible in seconds — compared to several days in some cases today, with the shipment-blocking risk that entails.
Buyers, who previously had no consolidated dashboard to arbitrate between suppliers on analytical grounds, gain access to a structured conformity history by supplier and product. Sourcing decisions can factor in analytical performance over time, not just a single point-in-time result.
Finally, regulatory traceability becomes defensible: control plan, applied thresholds, identified non-conformities and associated corrective actions. No longer a post-hoc reconstruction. A complete audit trail, available at any time.
Analytical data only has value if it is structured, comparative, and accessible. An archived PDF is not data — it is a document.
Managing laboratory analyses sits at the intersection of multiple simultaneous challenges: operational, commercial, regulatory, logistical. It is precisely because it touches so many different functions that this topic goes unaddressed: nobody truly owns it.
Tracklab operates from the principle that quality is the infrastructure feeding every function — R&D, procurement, sales, logistics, general management. It is not a cost center. It is a source of structured data. Provided it has the tools to be one.
A 30-minute demonstration on your own use cases. We can import a real analysis report to show the extraction live.
Simplify your management
Free your teams from reminders and spreadsheets. Track your compliance in real time, at scale.
Contact us